Mating Walnut Flies:
Back to Quiz
Principles of Animal Behavior:
Home
Modules
Contents
Links
Behavior News
Site Tour
About
Credits
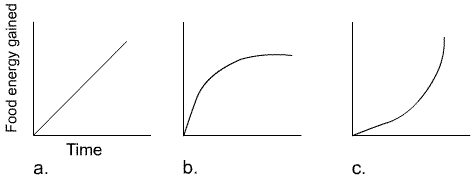
3. Which graph most accurately represents the shape of a gain curve?

graph a.
graph b.
graph c.
Correct! As time increases, the patch of food becomes less and less rewarding, and eventually the energy gained levels out. The shape of the curve is important, because the key to optimal foraging theory is that the activity becomes less rewarding over time -- the phenomenon of "diminishing returns."
Back to quiz page
