skip navigation Logo and link to home page

Mating Walnut Flies:
Back to Quiz

Principles of Animal Behavior:
Home
Modules
Contents
Links
Behavior News
Site Tour
About
Credits


Optimal Foraging Quiz

3. Which graph most accurately represents the shape of a gain curve?
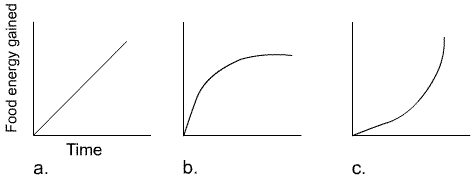
three graphs of food energy gained versus time: a. straight line b. convex curve c. concave curve

graph a.
graph b.
graph c.

Sorry! Try again.

Back to quiz page

    Previous
Top of page
Next

Mating Walnut Flies: Start | Contents
Principles of Animal Behavior: Home | Modules | Contents | Links | Behavior News
Problems using this page? Email the webmaster