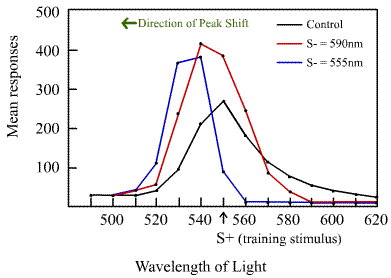
The "Peak Shift" Phenomenon
 In
1959, Hanson did a similar experiment. But in addition to training the
pigeons to peck at the S+ color, he also trained some to avoid a similar
color, called S-. In one case the S- color was very similar to the S+
color, and in another, the S- was more distant from S+.
When they were presented with a range of colors, the "control" pigeons (trained only to peck at S+) showed a pattern of generalization -- just as in the Guttman & Kalish experiment.
However, in the pigeons trained to avoid S-, the peak of the generalization curve was shifted away from the S- color.

Redrawn from Hanson (1959) (full reference)
In the case of the S- color that was distant from S+, the peak
shift was small. But when S- was very close to S+ (555nm and 550nm,
respectively), the peak shift was stronger.
Does this look a bit familiar? (hint: utility
function)
