Mating Walnut Flies: Optimal Foraging Quiz
1. A forager moves from an area where patches of food are close together
into an area where the patches of food are further apart. The forager
should spend _____ time in each patch than in the area with closely-spaced
patches.
a. less
b. more
c. the same
2. Moving from an area with less-rewarding patches of food into an area
with richly-rewarding patches, a forager should change its behavior by
spending _____ time in each patch.
a. less
b. more
c. the same
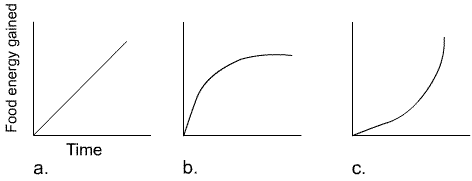
3. Which graph most accurately represents the shape of a gain curve?

graph a: (a straight line at a 45 degree
angle from the origin.)
graph b: (a convex line.)
graph c: (a concave line.)
Regardless of how you did on the quiz, we highly recommend the University
of Toronto optimal foraging web site.
